High-performing web applications drive more traffic, attract and retain more customers and make for a better brand image. However, achieving high performance is easier said than done – it is impossible without day-to-day monitoring of your web application, evaluation of its metrics and never-ending optimization to changing conditions. But which metrics are critical and which are less crucial? You will find it out in this article.
1. Average Response Time
Instant Loading: Building offline-first Progressive Web Apps – Google I/O 2016
If you want to test how your web application works from the user’s viewpoint, this is the most important metric to keep track of. Simply put, it is the amount of time your system needs to return a request of a visitor. However, in reality, it is a bit more complicated, because average response time may vary dramatically depending on a situation: how many concurrent users there are, how many transactions are requested at a given moment of time and so on. If you want your information to be useful, you have to test your application under many different sets of conditions – this will help you understand what needs improvement and optimization.
2. Throughput
Throughput is how many individual units of information your application can process in a limited period of time. It defines how much bandwidth is needed to deal with a particular workload (in your case, concurrent users with their requests). The greater your throughput is, the more concurrent users it can deal with. It is best to have a reserve that can handle a potential growth of your customer base because sudden overloads of your application’s capacity can make your service unavailable, which in turn will drive clients away. Throughput is among the most crucial metrics, and you should certainly think about choosing a tool that will be able to track it reliably.
3. Apdex Score
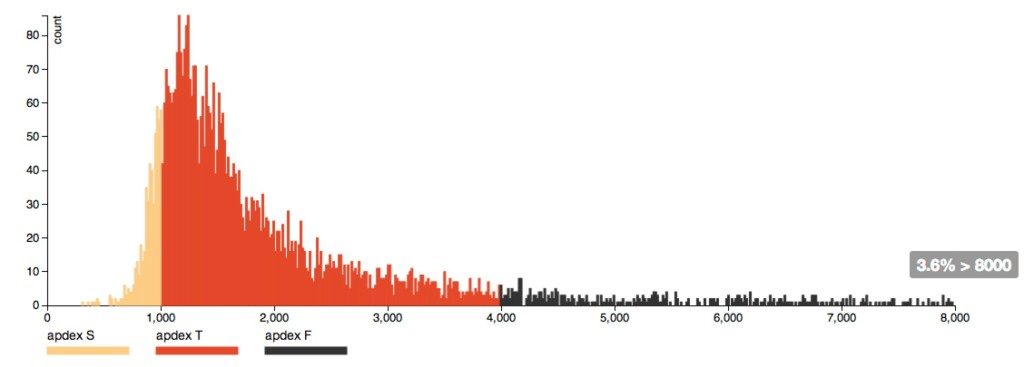
Breaking Down Apdex
Apdex score, or the application performance index, is a standardized and extremely widespread method of evaluating an application’s performance. It defines a specific value of how long this or that request should take. The requests are then divided into sufficiently quick, tolerably quick, too slow and failed requests. The apdex score itself is calculated using a simple formula, applying an index from 0 to 1. The closer your value is to 1, the better.
4. Peak Response Time
While average response time can give you a general idea of how well your application fares, peak response time is more useful in providing insights into what exactly can and should be improved. To put things into perspective, average response time may be a second; but this statistic won’t tell you that most elements load in less than a second while there is one element that takes ten times longer to load (peak response time). This one element’s loading time is the bottleneck of your performance, and this metric clearly indicates what you can do to optimize the performance of your app.
5. Error Rates

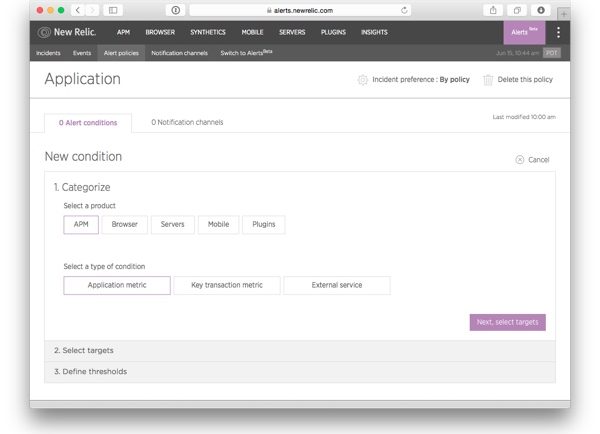
Get Started With Monitoring Your Web Application Using New Relic Alerts
Errors are problem requests, and this metric shows their percentage when compared to the total number of requests. Naturally, the fewer of them your users see, the better, but acceptable error rates may be very different from business to business. The good thing about this metric is that it allows to single out situations in which your web application starts to return more errors than normal. For example, your app may have an error rate within acceptable boundaries most of the time, but when 2000 concurrent users issue the same request, it rises dramatically. Knowing that this is when your app stops performing properly can help you take the necessary measures.
6. Request Rate
Understanding how much traffic goes through your application is crucial for understanding what needs to be done to improve its performance. After all, almost all other metrics are influenced in this or that degree by the amount of traffic your app has to deal with.
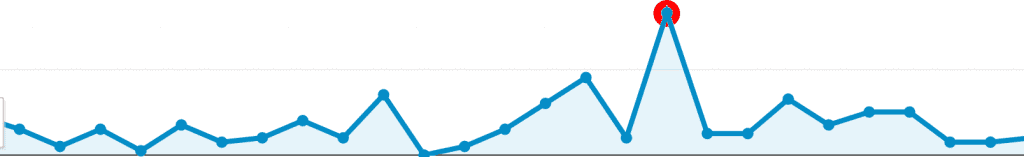
One way it can be used is to make correlations with other metrics to learn how well your app scales. It is also excellent to look out for spikes of activity and sudden drops in the number of requests.
7. Number of Concurrent Users
Estimating Concurrent Users for Load Testing With Google Analytics
This metric is related to the previous one but isn’t identical to it. Web applications are all too often not ready to sudden increases in the number of concurrent users trying to perform the same action – for example, as a result of a promotion or a highly anticipated launch. Learning to use and understand this metric will be instrumental in increasing the performance of your application.
Of course, these metrics aren’t the only one you should measure. We haven’t mentioned average connect time, application availability, requests per second and many other essential metrics; however, we believe that the ones we’ve covered are more than enough to get you started on your way to improving the performance of your app.