Data visualization is a pivotal aspect of modern analytics, transforming raw data into visual content for easier interpretation. In the realm of data visualization, pyramid charts lend a unique edge, offering a compelling way to represent hierarchical data. Pyramid charts find extensive use across various fields, from illustrating demographic populations in sociology to analyzing sales funnels in marketing. In this article, we dive deep to grasp the concept of pyramid charts and their application in different domains.
The Concept of Pyramid Charts

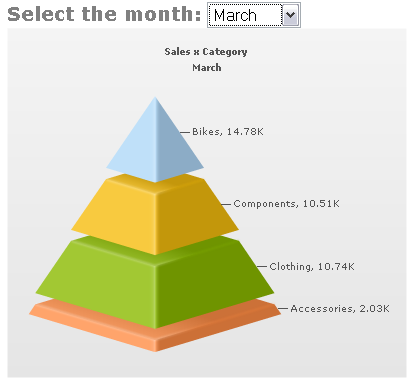
A pyramid chart, also known as a triangle chart, is a hierarchical chart where items are arranged sequentially from largest to smallest. Visually, it represents data in the form of a triangle or a pyramid where each layer corresponds to a particular data set. This specific arrangement allows for easy comparison across different data categories, facilitating instant and insightful decision-making.
Recognized for their ability to present data in a clear, concise, and meaningful manner, pyramid charts are lauded for their versatility. They can illustrate a variety of data, encompassing both continuous and categorical information. This adaptability further broadens the application spectrum of pyramid charts in diverse fields such as finance, marketing, human resources, and more.
Unlike other chart types, pyramid charts offer a dual-axis layout where one side depicts one data type, and the other represents a different data type. This juxtaposition allows for a parallel comparison, further enhancing understanding by revealing patterns that would be less visible in traditional chart types.
Unique Characteristics of Pyramid Charts
Pyramid charts possess distinctive characteristics that make them an ideal choice for representing various forms of data. One such feature is their symmetrical visual presentation, which facilitates easy comparison of different categories. With each level of the pyramid corresponding to a specific category, comparing different sections becomes straightforward and intuitive. In addition, their flexibility allows them to meaningfully represent both categorical and numerical data, paving the way for a broader range of applications.
Another standout feature of pyramid charts is their ability to accommodate a diverse array of data types. Whether it’s a binary comparison on one side of the pyramid or a multi-category comparison on the other, pyramid charts can handle it all. This multidimensional capability powers a richer data interpretation, regardless of the domain.
Lastly, pyramid charts provide clear, proportional sizes, which enables a clear visualization of the relative sizes between different categories. This unique characteristic invariably simplifies data comprehension, ultimately leading to more accurate and efficient decision-making.
Benefits of Using Pyramid Charts

The advantages of using pyramid charts are manifold. For starters, they offer an easy and intuitive way of data representation that improves data comprehensibility, particularly for the layman. The distinct visualization style aids in breaking down complex data into understandable chunks, facilitating better decision-making.
Apart from easy data interpretation, pyramid charts also enable quick comparison and understanding of patterns. By presenting data in a logical and cohesive manner, pyramid charts reveal patterns and trends that could have otherwise gone unnoticed. This valuable insight can guide the data-informed decision-making processes across various sectors, from finance and marketing to human resources and beyond.
Moreover, pyramid charts offer flexibility in data representation. They can represent a broad spectrum of data, be it binary or multi-category, numerical, or categorical. This versatile nature not only broadens their scope of application but also makes them a confounding choice for diverse business needs.
Altogether, whether it’s understanding population data or analyzing marketing trends, pyramid charts offer a versatile and intuitive solution to data visualization. They distinctively present data, allowing for easy comparison and interpretation, ultimately facilitating insightful decision-making. However, as with any tool, leveraging pyramid charts to their optimum potential requires mastering their intricacies, understanding their limitations, and deploying them judiciously according to the data at hand.